LCP optimization is the work of getting your Largest Contentful Paint below 2.5 seconds for 75% of real visits. The fastest route is not chasing a Lighthouse score: you break LCP into its four subparts — time to first byte, resource load delay, resource load duration, and element render delay — find which one owns the most milliseconds, and fix that one. Everything else is guesswork dressed up as optimization.
Most teams approach LCP optimization backwards. They run PageSpeed Insights, get a red number, and start working through the “Opportunities” list from top to bottom. Six weeks later the lab score is green, the field data has not moved, and nobody can explain why. This guide covers what LCP actually measures, how to find the real bottleneck in about fifteen minutes, and the fixes that reliably move field data.
What LCP Actually Measures
Largest Contentful Paint records the moment the largest image or text block visible in the viewport finishes rendering. It is Google’s proxy for “the page looks loaded to a human.”
Google’s threshold is 2.5 seconds or less, measured at the 75th percentile of real page loads — not the average. That distinction matters more than most people realise. A site with a 1.8-second median and a long tail of slow mobile sessions can fail comfortably, because the 75th percentile is dragged out by the worst quarter of visits. Optimising the median does nothing for that URL. You have to fix the tail.
The measurement Google actually uses comes from the Chrome UX Report, which aggregates anonymised field data from real Chrome users over a rolling 28-day window. That is what appears in Search Console and what feeds the page experience signal documented in Google’s Core Web Vitals guidance. Your Lighthouse score is a diagnostic tool. It is not the metric.
One more detail that trips people up: LCP is not final until the user interacts. The browser keeps updating the candidate element as the page loads, then locks the value on the first click, tap, or key press. Late-loading hero images therefore count in full, and lazy-loading your LCP image is one of the most common self-inflicted failures I see.
The Four Subparts: Where Your LCP Time Actually Goes
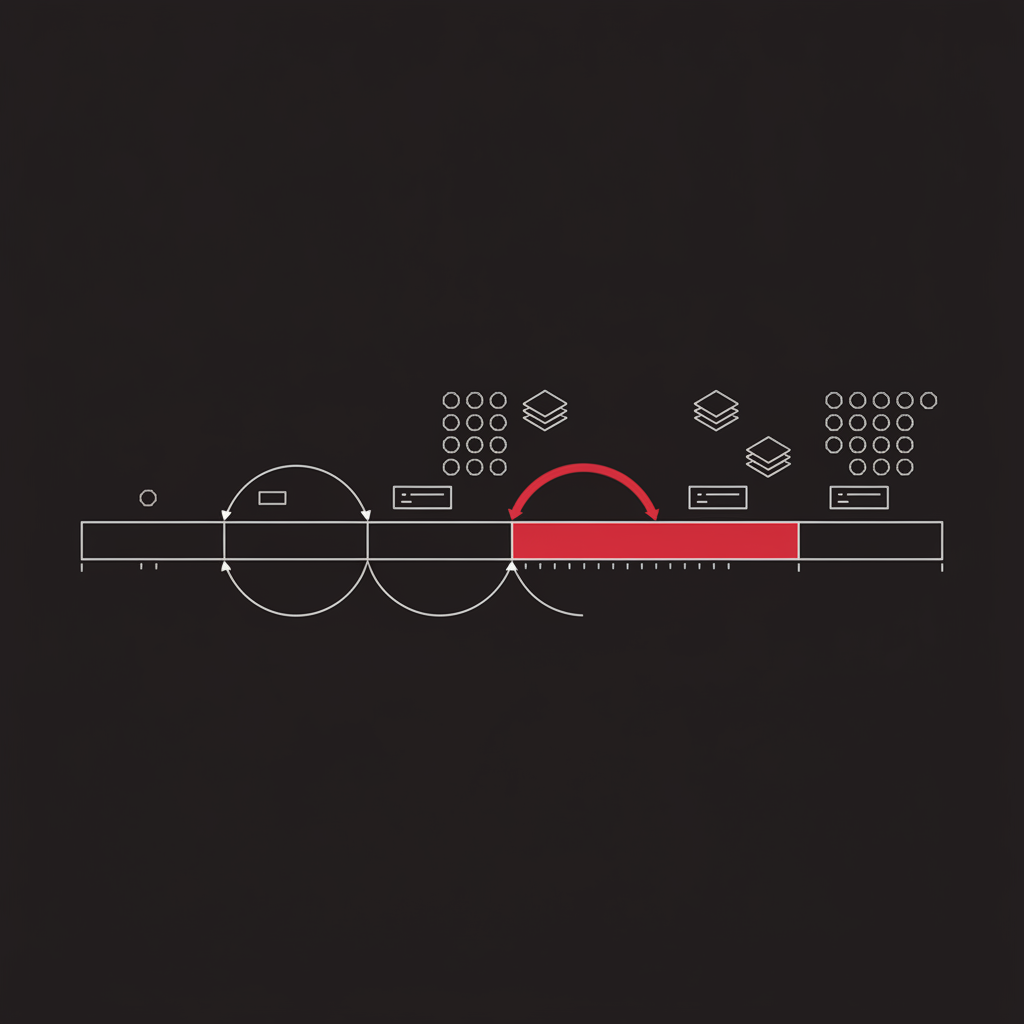
This is the single most useful framework in LCP optimization, and it comes straight from Google. Every LCP measurement decomposes into four consecutive phases:
- Time to first byte (TTFB) — from navigation start until the first byte of the HTML document arrives.
- Resource load delay — from TTFB until the browser starts fetching the LCP resource.
- Resource load duration — how long that fetch takes.
- Element render delay — from the resource finishing download until it actually paints.
Google’s optimize LCP guidance on web.dev sets a target distribution: roughly 40% of your LCP budget in TTFB, roughly 40% in resource load duration, and under 10% each in the two delay phases. The delays are pure waste — time when nothing is being downloaded and nothing is being painted. If either delay is eating 25% or 40% of your LCP, you have found your problem and you have not touched a single image yet.
That framing changes the work completely. “Compress your images” is useless advice for a page whose LCP is 3.8 seconds with a 2.1-second resource load delay. The image is not slow; the browser did not know it needed it until far too late.
Note that on most pages the LCP element is an image — a hero shot, a product photo, a background banner. Text-based LCP elements are usually easier, because text paints as soon as the font resolves, which collapses two of the four phases.
How to Diagnose LCP in 15 Minutes
Do not skip straight to fixes. Run this five-step process first and you will know exactly which of the four phases to attack.
- Pull the field data. Open Search Console → Core Web Vitals → Mobile, and identify the failing URL groups. Then run those representative URLs through PageSpeed Insights and read only the top section — the CrUX field data. Ignore the lab section for now.
- Identify the LCP element. In Chrome DevTools, open Performance, throttle to Slow 4G and 4x CPU slowdown, reload, and read the LCP marker in the Timings track. Write down what the element is.
- Break down the four subparts. The easiest way is the
web-vitalsJavaScript library, which reports LCP attribution including all four phases. Alternatively, read them off the DevTools network waterfall: TTFB is the document response, load delay is the gap between the document arriving and the LCP resource request starting, and so on. - Find the largest phase. Whichever of the four owns the most milliseconds is your project. Everything else is a distraction until that one is fixed.
- Check the discovery path. Ask how the browser learns about the LCP resource. Is it a plain
<img>in the initial HTML? Injected by JavaScript? A CSSbackground-image? The answer usually explains a large resource load delay on its own.
In my experience auditing ecommerce and SaaS sites, step five is where the diagnosis lands more often than not. The image is fine. The discovery is broken — the hero is set as a CSS background, or rendered by a client-side component, so the preload scanner never sees it and the fetch does not start until the main thread is already busy.
LCP Optimization for TTFB and Resource Load Delay
These two phases are where the cheap wins live, and where most teams never look.
For TTFB, the order of impact is consistent. Serve cached HTML from a CDN edge rather than generating it per request — this is the single largest TTFB lever for most sites and often cuts hundreds of milliseconds. Then eliminate redirect chains; every hop adds a full round trip, and a http → https → www chain can cost 400ms on mobile before the server does any work. Then fix slow backend queries and enable compression. If your TTFB is above 800ms, nothing downstream will save you.
For resource load delay, the fixes are mechanical:
- Put the LCP image in the initial HTML as a real
<img>tag so the browser’s preload scanner can find it before the parser reaches it. - Add
fetchpriority="high"to the LCP image. This tells the browser to promote it above the other images competing for bandwidth, and it is often worth several hundred milliseconds on its own. - Never set
loading="lazy"on an above-the-fold image. This is the most common LCP own goal in the wild. - If the LCP resource is a CSS background image or comes from a third party, add
<link rel="preload">with the correctasandfetchpriorityattributes. - Eliminate render-blocking resources ahead of it. Every synchronous stylesheet and blocking script in the
<head>delays the discovery and fetch of everything below.
Getting resource load delay under 10% of total LCP is usually a one-sprint job, and it is the highest ratio of impact to effort in the whole discipline. If you want a structured pass across all of this, it is standard scope in a technical SEO audit.
LCP Optimization for Load Duration and Render Delay
Once discovery is fixed, the remaining time is genuine transfer and paint work.
Resource load duration comes down to bytes and connection. Serve modern formats — AVIF or WebP over JPEG — and size the image to the largest viewport that will actually display it, using srcset and sizes so a phone never downloads a 2400px hero. Add <link rel="preconnect"> for any third-party origin serving the LCP resource, which saves the DNS, TCP, and TLS round trips. Getting the hero from 400KB to 90KB is normal and it is worth roughly a second on a mid-tier mobile connection.
Element render delay is almost always JavaScript or fonts. If the LCP element is text, a font loading with font-display: block will hold the paint hostage for up to three seconds — switch to swap or optional and preload the font file. If the LCP element is inside a client-side rendered component, the browser cannot paint it until the bundle downloads, parses, and hydrates; server-render or statically pre-render that part of the page. Also check for long tasks blocking the main thread at the moment the resource lands, since a fully downloaded image still cannot paint while the main thread is busy. Those long tasks are usually the same ones hurting your INP score, so the work compounds.
Why Your Lab Score and Field Data Disagree
You will hit this within a day of starting, so plan for it.
Lighthouse simulates one page load, on one emulated device, from one location, with a cold cache and no consent banner, no A/B testing script, no chat widget, and no logged-in state. Field data is every real visit: old Androids, congested networks, third-party tags that only fire in production, and users landing mid-session with a warm cache. The two numbers measure different things and they will not converge.
Use the lab for diagnosis — it is the only place you can see a waterfall and attribute time to a specific resource. Use the field for the verdict. And be patient with the verdict: because CrUX aggregates on a rolling 28-day window, the day you ship a fix your reported LCP still contains 27 days of pre-fix data. Teams routinely conclude a fix “did not work” on day three and revert it. Set the review date four weeks out and leave it alone.
If field data volume is too low for a URL group to report at all, monitor with real user monitoring instead. Any RUM setup using the web-vitals library gives you the same four-phase attribution against your own traffic, at whatever sample size you have.
What LCP Optimization Is Actually Worth
Be honest with your stakeholders about this, because overselling it damages trust when the ranking bump does not arrive.
Core Web Vitals are a real ranking signal, but a weak one. They function as a tiebreaker between pages of comparable relevance and authority. A fast page will not outrank a genuinely better page, and I have never seen an LCP fix rescue a site with a content or link problem. If your traffic is falling for other reasons, LCP is not the lever — that is a different diagnosis, and it usually starts with a full SEO audit rather than a performance sprint.
The stronger case is commercial. Users abandon slow pages before they see anything, which means every hundred milliseconds of LCP is paid for in bounce rate and lost conversions on exactly the traffic you worked hardest to earn. That argument survives contact with a CFO in a way “it might help rankings” does not.
So sequence it properly. Fix critical crawling and indexing problems first, get LCP and the other vitals into the green as table stakes, then put your real budget into content and links. If you are failing more than one vital, start with Cumulative Layout Shift — it is the cheapest of the three to fix and rarely needs infrastructure work. If you want a second opinion on where LCP optimization sits in your specific priority list, that is the kind of call I help teams make as a freelance SEO consultant — usually the answer is that LCP optimization is worth four focused weeks, and not a day more.
Frequently Asked Questions
What is a good LCP score?
Google considers an LCP of 2.5 seconds or less to be good, 2.5 to 4.0 seconds to need improvement, and anything above 4.0 seconds to be poor. The threshold applies at the 75th percentile of real page loads, so a quarter of your visitors can be slower than 2.5 seconds and the URL still passes. Lab scores from Lighthouse do not count toward this.
How do I find my LCP element?
Open Chrome DevTools, run a Performance trace, and look at the Timings track — the LCP marker names the exact element. PageSpeed Insights also reports it under the LCP diagnostic. On most pages it is a hero image, a banner, or the largest block of heading text above the fold.
Why is my LCP good in Lighthouse but bad in Search Console?
Lighthouse runs a simulated lab test on one device from one location with a cold cache. Search Console reports field data from the Chrome UX Report — real visits on real devices and networks over a rolling 28-day window. Field data includes slow phones, poor connections, and third-party scripts your lab test never loaded, so it is almost always worse and it is the only version Google uses.
Does LCP affect Google rankings?
It does, but weakly. Core Web Vitals are a page experience signal that acts as a tiebreaker between pages of comparable relevance and authority — it will not move a weak page above a strong one. The stronger business case for LCP optimization is conversion rate, since slow pages lose users before they ever see the content.
How long do LCP improvements take to show in Search Console?
Around 28 days for the full effect. The Chrome UX Report aggregates a rolling 28-day window, so the day you ship a fix, your reported LCP still contains 27 days of old data. You should see movement within a week and the final number by day 28 — do not judge a fix before then.