Cumulative Layout Shift measures how much the visible content of a page moves around unexpectedly while it loads and while someone is using it. A good CLS score is 0.1 or less at the 75th percentile of real user data, and unlike the other two Core Web Vitals, most CLS failures come from a handful of predictable causes you can fix in an afternoon. This guide covers how CLS is actually calculated, the five patterns behind almost every failure, and a six-step process to fix them.
CLS is the Core Web Vital with the highest pass rate across the web, which is exactly why failing it is so damaging. If your competitors are passing and you are not, you are handing away a tie-breaker on a problem that is mostly solvable with CSS. In my experience auditing sites, a red CLS is almost never a hard engineering problem — it is a governance problem, where nobody owns the third-party scripts and injected widgets that cause the shifts.
What Cumulative Layout Shift actually measures
CLS is not a count of shifts. It is a score built from two multiplied fractions, defined in Google’s web.dev documentation on CLS:
- Impact fraction — the share of the viewport affected by the moving element, combining where it was and where it ended up.
- Distance fraction — the greatest distance any unstable element travelled, as a share of the viewport’s largest dimension.
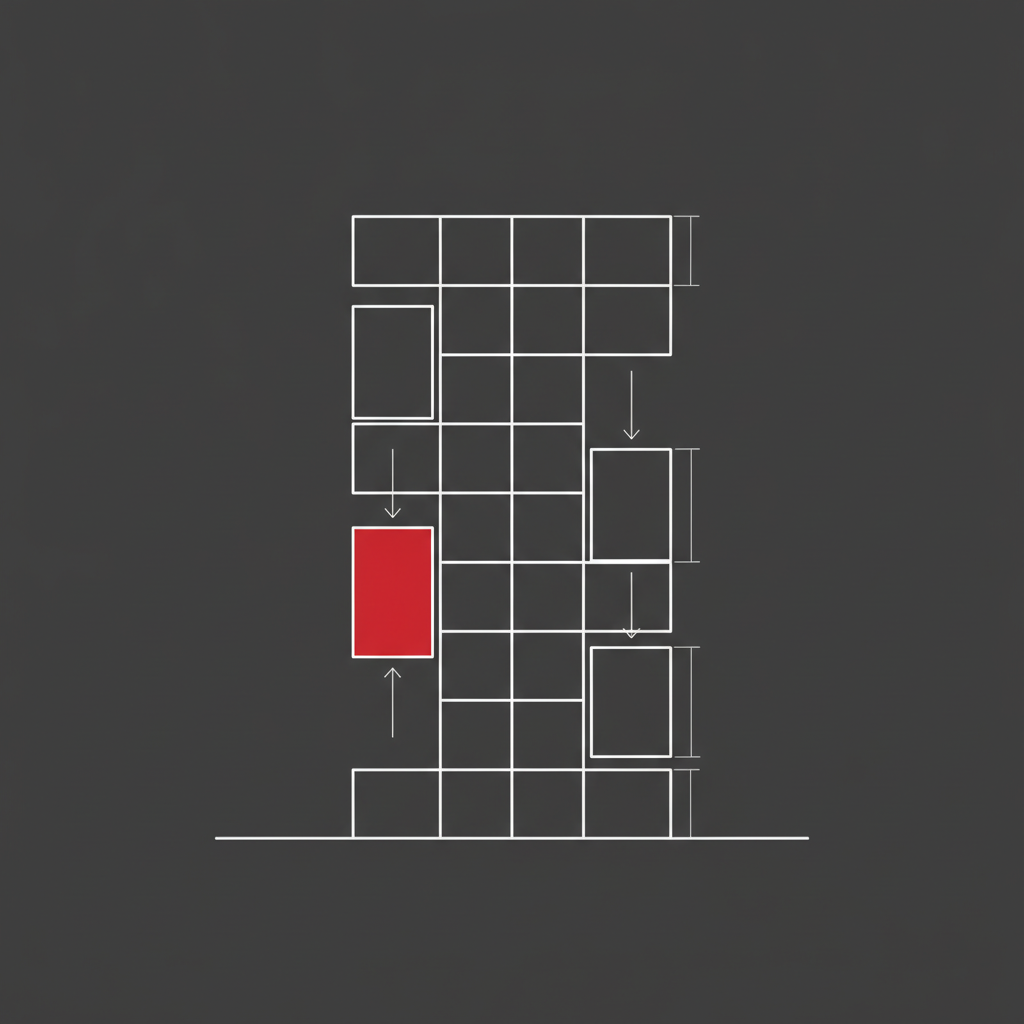
Multiply the two and you get the layout shift score for that shift. A banner that occupies half the viewport and pushes everything down by a quarter of the screen scores 0.5 × 0.25 = 0.125. One shift, and you have already failed.
That formula explains something teams find counterintuitive: a huge number of tiny shifts is often less damaging than one large one. Chasing every sub-0.001 shift in DevTools is wasted effort. Find the one element that moves a lot of pixels a long way.
The session window rule
CLS was originally a running total for the entire page lifetime, which punished long sessions unfairly. Google changed it in June 2021 to use session windows: shifts are grouped into windows that last a maximum of 5 seconds, with any gap of more than 1 second starting a new window. Your reported CLS is the score of the worst window, not the sum of all of them.
This matters practically. It means one badly behaved element in a single burst decides your score. It also means you cannot “average out” a bad shift by having a long, stable session afterwards.
What is excluded
Two exclusions save you from false positives. Shifts that occur within 500 milliseconds of a user interaction — a click, tap, or key press — do not count, because the user asked for the change. Shifts caused by scrolling are also excluded. Everything else counts, including a cookie banner that appears eight seconds into a visit.
Why most CLS problems are invisible in the lab
This is where teams lose weeks. Lighthouse gives you a green CLS, everyone signs off, and Google Search Console keeps reporting the URL group as failing. Both tools are correct — they are measuring different things.
Lighthouse runs a single synthetic load in a controlled environment. It does not scroll, does not click, does not wait for a lazy-loaded module three screens down, and often does not trigger the consent banner because it has no prior cookie state. Real users do all of those things.
Field data comes from the Chrome UX Report, which aggregates measurements from real Chrome users who have opted in. That is the data Google uses for page experience signals, and it is what appears in the Core Web Vitals report in Search Console and in the top section of PageSpeed Insights.
The rule: diagnose in the lab, decide in the field. Use Lighthouse and DevTools to find the mechanism of a shift. Use CrUX field data to decide whether it is worth fixing and whether your fix worked. Never the other way round.
Field data also lags. The Chrome UX Report uses a rolling 28-day window, so a fix deployed today will not fully show up in Search Console for four weeks. Plan for that in your reporting or you will get asked why nothing changed.
The five causes of cumulative layout shift I see on almost every site
After enough audits, the same five patterns account for the overwhelming majority of layout shift problems. Work through them in this order.
1. Images and video without dimensions. The browser cannot reserve space for a resource whose size it does not know, so it lays out the page without it and reflows when it arrives. Setting width and height attributes on the element lets the browser compute an aspect ratio and hold the space. Modern browsers derive aspect-ratio automatically from those attributes, so this single fix eliminates an entire class of shifts.
2. Ads, embeds, and iframes. Third-party slots are the worst offenders because their dimensions arrive from a remote server after your page has already rendered. Reserve the largest plausible size with a min-height container, and never collapse an unfilled slot back to zero mid-session.
3. Web fonts. When a fallback font is swapped for a web font with different metrics, every line of text reflows. This produces shifts that are wide and shallow — a low distance fraction but a very high impact fraction, because the affected area is most of the viewport.
4. Dynamically injected content. Cookie banners, promo bars, “we use cookies” strips, chat widgets, personalisation blocks, and A/B test variants that insert DOM above existing content. If it appears at the top of the document after first paint, it shifts everything below it.
5. Animations on layout-triggering properties. Animating top, left, width, height, or margin forces the browser to recalculate layout on every frame. Animating transform and opacity does not, because those run on the compositor. This is the cheapest fix on the list and it also helps interaction responsiveness.
A six-step process to fix cumulative layout shift
Here is the sequence I use on client sites. It is deliberately ordered so that the cheapest, highest-yield fixes come first.
Step 1 — Get a field baseline per template. Open the Core Web Vitals report in Search Console and note the failing URL groups. Do not work URL by URL. Group by template — product page, category page, blog post, homepage — because the fix will apply to the whole template.
Step 2 — Reproduce with the right conditions. In Chrome DevTools, open the Performance panel, enable Layout Shift Regions in the Rendering drawer, throttle to Slow 4G and 4× CPU, and record a full session including scrolling to the fold and beyond. Clear cookies first so the consent banner fires. Most teams skip this and never see the shift that is actually failing them.
Step 3 — Fix dimensions everywhere. Add width and height to every <img> and <video>, and set an aspect-ratio on any container whose contents load asynchronously. This is the single highest-yield change on most sites.
Step 4 — Reserve space for third parties. Every ad slot, embed, review widget, and chat launcher gets a fixed-height container in the CSS before its script runs. If you genuinely cannot predict the height, render the widget below the fold or into a fixed-position overlay that does not participate in document flow.
Step 5 — Match your font metrics. Preload the primary font file, use font-display: swap, and define a @font-face fallback with size-adjust, ascent-override, and descent-override tuned so the fallback occupies the same vertical space. Tools like Fontaine or Next.js font optimisation generate these values automatically.
Step 6 — Move injected content out of flow. Consent banners and promo bars should render as fixed overlays, or be server-rendered into the initial HTML so they exist before first paint. Never inject them into the top of the body with JavaScript after load.
Then wait 28 days and re-check the field data. Not before.
Tools that actually help, and the ones that mislead
Use these:
- Search Console Core Web Vitals report — field data, grouped by template. Your source of truth for whether a problem exists.
- PageSpeed Insights — field data plus a lab run for a single URL, useful for confirming a specific page.
- Chrome DevTools Performance panel with Layout Shift Regions — the only reliable way to see which element moved.
- The
web-vitalsJavaScript library — attributes each shift to a specific DOM element in your own real-user monitoring, which is the closest thing to a debugger for production CLS.
Be careful with these:
- Lighthouse scores in isolation — a green lab CLS proves almost nothing, for all the reasons above.
- Third-party “site speed” grading tools — most run a single desktop load from one location and report a number that has no relationship to your CrUX data.
- Repeated PageSpeed runs — lab CLS varies between runs. Chasing the variance is not optimisation.
For a broader view of how these fit together, my technical SEO audit process covers Core Web Vitals alongside crawling, indexing, and rendering, because performance fixes rarely pay off in isolation.
Where CLS sits in technical SEO priorities in 2026
Let me be direct about the ranking impact. Core Web Vitals are part of Google’s page experience signals, and Google Search Central’s own documentation is explicit that great page experience does not override having genuinely relevant content. Fixing cumulative layout shift will not rescue a page that does not deserve to rank.
What it does do is remove a tie-breaker working against you, and — more importantly — stop costing you money. A layout shift that moves a button under a user’s thumb mid-tap is a mis-click, an abandoned form, or a wrong item added to a basket. Every study of interface stability points the same direction on conversion, and unlike ranking effects, that impact is immediate and measurable in your own analytics.
My working priority order for a site failing multiple Core Web Vitals: fix CLS first, because it is the cheapest and most self-contained. Then LCP, because it needs infrastructure and asset work. Then INP, because it usually means rethinking how much JavaScript you ship. Once all three pass in the field, stop optimising performance and move budget to content and links, where the actual ranking gains are.
That sequencing matters more than any individual fix. I have watched teams spend two quarters shaving 200ms off LCP while their category pages had no internal links and thin copy. Cumulative Layout Shift deserves an afternoon of focused work and a place in your deploy checklist — not a standing workstream. If you want a second opinion on where your own priorities should sit, that is exactly what an independent SEO consultant is for.
Frequently Asked Questions
What is a good CLS score?
A good Cumulative Layout Shift score is 0.1 or less at the 75th percentile of your field data, measured separately for mobile and desktop. Between 0.1 and 0.25 needs improvement, and above 0.25 is poor. Because Google uses the 75th percentile, a quarter of your real page views can be worse than your reported score and you still pass.
Is CLS a Google ranking factor?
Indirectly, yes. CLS is one of the three Core Web Vitals, and Core Web Vitals feed the page experience signals Google uses as a tie-breaker between pages of similar relevance. A poor CLS will not sink strong content on its own, but it loses you the close calls and it reliably hurts conversion rates — which is the better reason to fix it.
Why is my CLS different in PageSpeed Insights and Lighthouse?
They measure different things. Lighthouse runs one synthetic load and never scrolls or clicks, so it misses shifts from lazy-loaded content, consent banners, and late scripts. PageSpeed Insights also reports Chrome UX Report field data from real users, which is what Google actually uses. Trust the field data.
Do shifts after a user clicks count towards CLS?
Not if they happen within 500 milliseconds of the interaction. Google excludes shifts that follow a click, tap, or key press because the user caused them. Shifts from scrolling are excluded too. Everything else counts, including a banner that appears well into a session.
How long does it take for a CLS fix to show in Search Console?
The Chrome UX Report uses a rolling 28-day window, so expect roughly four weeks before a deployed fix is fully reflected in the Core Web Vitals report. You can confirm the fix immediately in your own real-user monitoring with the web-vitals library, which is why I recommend having it in place before you start.