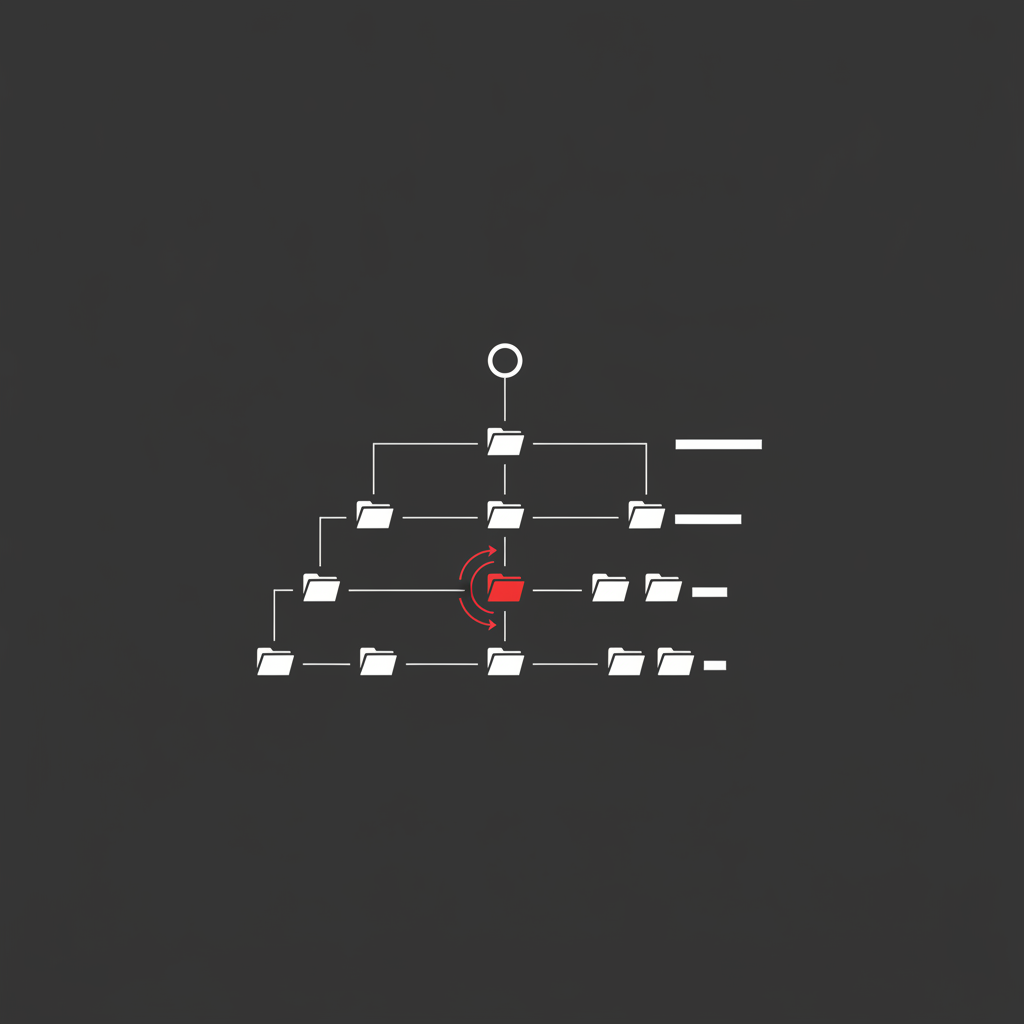
TTFB optimization is the work of cutting the time between a browser requesting a page and the first byte of the response arriving. Google treats a Time to First Byte under 800 milliseconds as good and anything past 1,800 milliseconds as poor, measured on real users at the 75th percentile. Because that time is spent before the browser can render anything at all, it sets the floor for your Largest Contentful Paint — you can never be faster than your server.
Most performance work starts in the wrong place. Teams spend a sprint compressing images and deferring scripts while the origin sits there taking 1.4 seconds to answer. Nothing in the front end recovers that time. TTFB optimization is unglamorous — it lives in hosting config, cache rules and database queries rather than in a bundle — which is exactly why it stays broken on so many otherwise well-built sites.
What TTFB actually measures
Time to First Byte is the interval from the start of the navigation request to the moment the first byte of the HTML response reaches the browser. According to Google’s web.dev documentation, it is a sum of several phases rather than a single number:
- Redirect time — every hop before the final URL responds.
- Service worker startup — if one is registered and has to boot.
- DNS lookup — resolving the hostname to an address.
- Connection and TLS negotiation — the handshake cost.
- Request and response — everything the origin does before it flushes the first byte.
That last phase is where most teams look, and often where the problem is not. I have lost count of the audits where the origin was answering in 180 milliseconds and the measured TTFB was over a second because of a redirect chain and a slow resolver sitting in front of it.
One more thing worth being precise about: TTFB is a diagnostic metric, not a Core Web Vital. It does not appear in Search Console’s Core Web Vitals report and no ranking threshold is attached to it. That distinction is real, and it is also why so many teams deprioritise it. The correct reading is that TTFB is not scored directly — it is consumed by a metric that is.
Why TTFB optimization is an SEO problem
Largest Contentful Paint has to land within 2.5 seconds at the 75th percentile of real traffic to pass. Google’s LCP optimization guidance breaks that budget into four sub-parts and recommends TTFB take no more than roughly 40% of it — about 800 milliseconds. The remaining 60% covers resource load delay, resource load duration and element render delay.
Do the arithmetic. If your TTFB is 1.2 seconds, you have spent nearly half the LCP budget before a single byte of HTML has been parsed. You are now trying to discover, download and paint a hero image in 1.3 seconds on a mid-range phone over a mobile connection. It rarely happens.
This is why TTFB optimization is usually the highest-leverage fix on a failing page. A 500-millisecond reduction at the server flows straight through to Largest Contentful Paint for every user, on every template, with no front-end work at all. Very little else in performance engineering has that blast radius per hour of effort.
The second reason is crawl. Google’s crawl budget documentation states plainly that Googlebot adjusts its crawl rate based on how the server responds: if the site slows down or starts returning server errors, the crawl limit drops. On a large ecommerce catalogue or a programmatic build, server response time stops being a UX detail and becomes the throttle on how much of your site gets discovered and refreshed.
Both paths are indirect. Neither is theoretical. A slow origin costs you the close ranking calls through Core Web Vitals and costs you index coverage through crawl rate, and it does both quietly.
How to measure TTFB before you change anything
Field data first, always. Lab tools measure your office broadband, not your users.
- Chrome UX Report via PageSpeed Insights gives the real 75th-percentile TTFB for a URL or origin on a 28-day rolling window. This is the number that matters.
- Search Console’s Core Web Vitals report will not show TTFB directly, but a widespread LCP failure with no obvious render-blocking cause is nearly always a server problem.
- The Navigation Timing API in the field —
performance.getEntriesByType('navigation')[0].responseStart— collected through your RUM tool and segmented by template and country. curl -wfrom several regions for a clean, uncached reading of the origin on its own.
The segmentation step is the one people skip and the one that finds the bug. In my experience auditing mid-market sites, an origin-level TTFB average almost always hides the real story: the homepage is cached and fast, and one uncached template — search results, a filtered category, an account page — drags the 75th percentile over the threshold by itself.
So measure by template, then measure cached versus uncached separately. A page that serves in 40 milliseconds from a CDN edge and 1.6 seconds on a cache miss does not have a server speed problem. It has a cache hit ratio problem, and the fix is completely different.
The seven-stage TTFB optimization audit
Work these in order. Each stage sits in front of the next, so fixing stage six while stage two is broken changes nothing a real user experiences.
1. Redirects. Count the hops on your canonical entry points. http:// → https:// → www. → final URL is three round trips before the server has done any work, and each costs a full resolve-connect-request cycle on a cold connection. Collapse them to a single redirect at the edge. This is the cheapest 200–400 milliseconds most sites will ever find.
2. DNS. Check resolution time from the markets you actually serve. A cheap registrar’s nameservers with no anycast can add 100 milliseconds for users far from the authoritative server. Move to a provider with global anycast DNS and set sensible TTLs.
3. Connection setup. Confirm HTTP/2 or HTTP/3 is being negotiated, TLS 1.3 is in use, and session resumption is enabled. Check that OCSP stapling is on — a browser blocking on a certificate status check is a real and invisible tax on server response time.
4. Edge caching. What share of HTML requests is served from the CDN edge rather than the origin? If you cache static assets and pass every HTML request through, the single biggest win is still sitting on the table. Cache the document with a short TTL and stale-while-revalidate, and purge on publish.
5. Origin cache. Behind the CDN, is there a full-page cache, an object cache, or nothing? Uncached templates are where TTFB goes to die. List them by name, then decide for each one: fully cacheable, partially cacheable with edge-side includes, or genuinely dynamic.
6. Application work. For templates that truly cannot be cached, profile the request. The usual suspects are N+1 database queries, unindexed lookups on a large table, synchronous third-party API calls inside the request path, and session handling that hits the database on every page load. Move anything not needed to render the response out of the request cycle.
7. Infrastructure. Only now is it reasonable to ask whether the server is undersized, whether the database is in a different region from the application, or whether the hosting plan is the constraint. Upgrading hardware before working stages one to six buys speed at the worst possible price per millisecond.
The fixes that actually move the number
Some interventions consistently deliver and some are theatre. Roughly in order of return:
Cache the HTML at the edge. For any site whose pages do not differ per user, this is the whole game. A cached document served from an edge node near the user turns a 900-millisecond TTFB into an 80-millisecond one. Everything else on this list is smaller.
Kill the redirect chain. Free, fast, permanent. Handle protocol and host canonicalisation in one edge rule instead of passing the request down a ladder of server-level rewrites.
Fix the slowest query, not all of them. Profile the uncached template and you will usually find one query accounting for most of the server time. Fixing it is an afternoon. Rewriting the data layer is a quarter.
Move rendering closer to the user. If the site is server-rendered from one region while a third of traffic sits in another, distance alone is 100–150 milliseconds of unavoidable latency. Edge rendering or regional read replicas remove it.
Use stale-while-revalidate. Serve the cached copy instantly and refresh it in the background. Users get edge-speed responses and a cache miss stops being a cliff.
Stream the response. If your framework supports it, flush the document head — with its preload and preconnect hints — before the body is assembled. The browser starts fetching critical resources while the server is still working. This does not reduce server time, but it reduces how long the browser sits idle, which is what LCP actually measures.
What does not work: compressing HTML harder, switching image formats, deferring JavaScript. Those are real optimizations and none of them touch Time to First Byte. They improve what happens after the first byte arrives.
Where TTFB optimization goes wrong
Optimising the average. Core Web Vitals are assessed at the 75th percentile. A healthy median with a heavy tail still fails. Look at p75 and p95, never the mean.
Testing from one location. A TTFB measured from a datacentre in the same region as your origin is fiction. Test from where your users are.
Believing the lab over the field. PageSpeed Insights shows a lab run and field data side by side. Google uses the field data. When they disagree, the field wins.
Caching what should not be cached. Serving one logged-in user’s page to another from a shared cache is a genuine security incident, not a performance bug. Set Cache-Control: private on personalised responses and vary the cache key deliberately.
Declaring victory too early. The Chrome UX Report runs on a 28-day rolling window. You will not see a fix land in field data for weeks, and flat numbers at day ten are not failure. Ship, wait, then judge.
Shipping five fixes at once. Tempting, and it destroys your ability to attribute the improvement. Sequence them, or accept you will never know which one mattered — a trade-off worth making explicit rather than stumbling into. This is the same discipline that makes SEO A/B testing worth the setup cost.
Start with the server, then go win the rankings
When server response time is the constraint, it usually surfaces as an LCP failure nobody can explain from the front end. That is the moment to stop optimising images. A technical SEO audit with template-level TTFB segmentation will find the cause faster than another round of Lighthouse runs, and it is the kind of work worth bringing in a freelance SEO consultant for, because it needs someone who can read a waterfall and a query plan in the same afternoon. If the fix turns out to be architectural, it belongs in a technical SEO roadmap rather than a ticket.
TTFB optimization will not win you a competitive keyword on its own. Content and links do that. But a slow origin caps every performance metric downstream of it, throttles how much of your site Google is prepared to crawl, and quietly devalues every other optimization you ship. Fix the server first. Then go and win the rankings where they are actually won.